Thursday, October 3, 2013
Link to Big Data Article
I have not posted in a while due work picking up and the fact that I am back teaching two classes at Pima Community College (Introduction to Assembler and Introduction to C#). However, I wanted to post this great article about from Wired, Big Data is Too Big for Scientist to Handle Alone.
Friday, August 9, 2013
The Doppler Effect and the Police: A Match Made in Heaven: Or How Does a Radar Gun Work?
Radars can measure distance and they can measure velocity of objects. A police (or baseball) radar gun measures speed. To measure velocity, radar’s take advantage of the Doppler effect.
The Doppler effect is basically when the radar's frequency (how quickly the signal moves up and down) is different of what the radar expects it to be when it receives the reflected wave when it comes back or is received to the radar. When a wave hits an object that is not moving the frequency of the radar does not change, but when an object is moving the phase compresses when an object is moving toward the transmitting radar and decompresses when an object is moving away. When the frequency changes, it is called a Doppler shift. A larger Doppler shift translates to higher speed. A Doppler radar keeps track of what the expected wave frequency should be when the radar receives the signal if an object in not moving; when it receives a signal that has a different frequency than what it expects, it measures the difference between what the radar says it should be and calculates the speed of the object.
However, as any radar/light/x-ray etc. beam moves away from the transmitter the beam spreads. Think about a flashlight, as it gets further away the beam spreads, the same thing happens with a radar. That is why when you get pulled over the state trooper or police officer will say something about he got a good read on you, which is his way of telling you that there were not cars around that there is a good chance that the beam was not calculating the speed of other cars around you.
On some car radar detector, you may see that they can detect Ka and X band radar which tells you what frequency they are transmitting at. Police usually use radars with a frequency of Ka or X which are about 35 GHz or 10 GHz, respectively. 35 MHz means the radar wave fluctuated up and down 35 billion times per second. For comparison, an over the air TV signal transmits at UHF which is between 400 and 800 MHz (400 to 800 million hertz) and light transmits at 430 THz (trillion hertz) for red and 750 THz (trillion hertz) for violet. Radars are what is called coherent which means the Doppler can be measured. The newer laser radar also called lidar, light radar, the police use are not coherent. So how do they work?
A lidar can measure speed based on repeatedly measuring the distance an object of interest. Police like lidars because they have a narrower beam which makes them less likely to get measurements from multiple cars and they are harder to jam. Instead of using radar, lidars use a beam frequency that is infrared which is not visible to the naked eye, but has similar properties to visible light like a much narrower beamwidth. Like a radar, a lidar can measure range based on the fact that light and all waves travel at the speed of about 300,000,000 meters/second or about 671,000,000 mph (the speed of light constant). A lidar measures the time between it transmits and receives a pulse, then multiples that time by the speed of light and divides by two (to account for the time it takes for the beam to travel to and from the object). For example, if you were 150 meters from the lidar it would take 0.000 001 seconds for the beam to transmit and be received by the lidar gun (300,000,000 m/s times 0.000 001s divided by 2). It then does that measurement many times in less than a second then calculates the change in distances over that period to calculate your speed. For example, you went from 150 meters away to 110 meters away in a second you were traveling 40 m/s or about 90 mph (and if a cop measured you would probably get pulled over).
For both radar and lidar, the speed measurements are the most accurate if your car is going directly at the radar beam, since police or radar cameras are on the side of the road the speed measurement is not going to be the true speed you are going. Unfortunately, the speed the radar gun collects is slower than your actual speed, so it is not an error you can use to get out of a ticket.
To counteract the radar guns some people use radar jammer or scramblers, you can read more about these in a previous blog, but basically the radar jammers figure out what frequency the police officer has and sends out a nonsense signal at the frequency so the cops gun cannot detect the speed. These jammers are generally illegal for civilians to have since they transmit high energy radio waves which are regulated by the Federal Communication Commission (FCC).
Lidar guns are much harder to detect and jam because laser beams are much narrower than radar (that is why most police agencies using them now), but a laser jammer works in the same way as radar jammer.
Most police point lidar guns at your front license plate since it is a flat surface and it will bounce back more directly to the lidar gun. To counter act that, some people use techniques that are used by stealth aircraft to counteract radar. Stealth airplanes use the fact that if the beam does not get back to the receiver, a measurement cannot be made, so they have body shapes that reflect the beam away from the receiver with offset shapes and have radar absorbing paint, so some dedicated people have lidar absorbing paint on their cars and license plates or have their license plates slanted so the beam will bounce in to the sky.
This game of coming up with counter-measures for radars and then coming up with counter-counter-measures radars is played by both drivers and police as well as militaries when it comes deceiving radar.
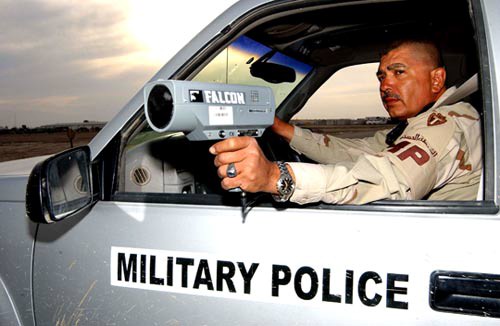 |
| Army MP using radar in Iraq |
Basics of a Doppler Radar
 |
| Doppler effect model showing compressed waves on the right as the object moves toward something and decompressed waves on the left side as it moves away |
On some car radar detector, you may see that they can detect Ka and X band radar which tells you what frequency they are transmitting at. Police usually use radars with a frequency of Ka or X which are about 35 GHz or 10 GHz, respectively. 35 MHz means the radar wave fluctuated up and down 35 billion times per second. For comparison, an over the air TV signal transmits at UHF which is between 400 and 800 MHz (400 to 800 million hertz) and light transmits at 430 THz (trillion hertz) for red and 750 THz (trillion hertz) for violet. Radars are what is called coherent which means the Doppler can be measured. The newer laser radar also called lidar, light radar, the police use are not coherent. So how do they work?
LIDAR Speed Guns
A lidar can measure speed based on repeatedly measuring the distance an object of interest. Police like lidars because they have a narrower beam which makes them less likely to get measurements from multiple cars and they are harder to jam. Instead of using radar, lidars use a beam frequency that is infrared which is not visible to the naked eye, but has similar properties to visible light like a much narrower beamwidth. Like a radar, a lidar can measure range based on the fact that light and all waves travel at the speed of about 300,000,000 meters/second or about 671,000,000 mph (the speed of light constant). A lidar measures the time between it transmits and receives a pulse, then multiples that time by the speed of light and divides by two (to account for the time it takes for the beam to travel to and from the object). For example, if you were 150 meters from the lidar it would take 0.000 001 seconds for the beam to transmit and be received by the lidar gun (300,000,000 m/s times 0.000 001s divided by 2). It then does that measurement many times in less than a second then calculates the change in distances over that period to calculate your speed. For example, you went from 150 meters away to 110 meters away in a second you were traveling 40 m/s or about 90 mph (and if a cop measured you would probably get pulled over).
 |
| Police officer with a lidar gun |
For both radar and lidar, the speed measurements are the most accurate if your car is going directly at the radar beam, since police or radar cameras are on the side of the road the speed measurement is not going to be the true speed you are going. Unfortunately, the speed the radar gun collects is slower than your actual speed, so it is not an error you can use to get out of a ticket.
Speed Gun Jammers
To counteract the radar guns some people use radar jammer or scramblers, you can read more about these in a previous blog, but basically the radar jammers figure out what frequency the police officer has and sends out a nonsense signal at the frequency so the cops gun cannot detect the speed. These jammers are generally illegal for civilians to have since they transmit high energy radio waves which are regulated by the Federal Communication Commission (FCC).
Lidar guns are much harder to detect and jam because laser beams are much narrower than radar (that is why most police agencies using them now), but a laser jammer works in the same way as radar jammer.
Most police point lidar guns at your front license plate since it is a flat surface and it will bounce back more directly to the lidar gun. To counter act that, some people use techniques that are used by stealth aircraft to counteract radar. Stealth airplanes use the fact that if the beam does not get back to the receiver, a measurement cannot be made, so they have body shapes that reflect the beam away from the receiver with offset shapes and have radar absorbing paint, so some dedicated people have lidar absorbing paint on their cars and license plates or have their license plates slanted so the beam will bounce in to the sky.
This game of coming up with counter-measures for radars and then coming up with counter-counter-measures radars is played by both drivers and police as well as militaries when it comes deceiving radar.
Saturday, July 27, 2013
What is a Jammer?
Tucson company
Raytheon just won a major contract to develop upgraded radar jammers to the US
Navy for the F/A-18s. I thought this would be a good opportunity to explain radar
jamming. My first notion of radar jamming came from the 1987 Star Wars spoof,
Spaceballs. So, I felt the need to include a clip of the radar jamming scene
below.
This scene inspired me to ask 25 years ago, “What is radar jamming?”
The way the most
jammers work is they figure out what frequency the antagonist radar is at (think
of a radar frequency as just like a radio frequency, it is basically the
station you are transmitting your radar at.) Then they send out a stronger
signal of noise (gibberish) at a higher magnitude or power than your radio to
drown out your information from the radar. It is like when you are watching TV
when someone is vacuuming in your house to cover up the sound of the vacuum you
increase the volume of the TV. Think about jamming as turning up the volume on
their signal to try to disrupt it except instead of sound radars use radio
signals.


To counter jamming,
the radar can change its frequency like constantly changing stations so the jammer
cannot block the message. Like when you change stations when the static for one station gets too bad.
Radar jamming is one
type of way to prevent a radar from figuring where you are and how fast you are
going. Electronic attack (EA) is what jamming and other ways to prevent a radar
from working are called. The list of things that can be done to prevent EA is
called electronic counter-measures (ECM). I will talk about more of these in
another blog.
Wednesday, July 24, 2013
You Have an AM/FM Radio, What's TM?
Tucson company TM Technologies Inc announced they have demonstrated
a new way to transmit information in electromagnetic waves according to announcements
in the Arizona Daily Star and TVTechnology.
For me, this is a local interest story since I live and work in Tucson; however, this technology has the potential to revolutionize communication. According to their press release they demonstrated a new way to modulate electromagnetic waves which they call transpositional modulation (TM). A TM wave is opposed to a frequency modulation or amplitude modulation which you may recognize as FM and AM on your car radio.
FM is a way transmit information by changing the frequency (the number of wavelengths/second that travel across a particular point) of the wave. AM transmits data by increasing the power of the transmission wave. There is a third way of transmitting data called phase modulation (PM) which changes the phase of wave, basically by shifting the phase from a sine to cosine. PM and FM are very similar because FM is the derivative of PM and many people consider PM and FM to be the same.
 |
| Top: base signal Middle: base signal with AM to carry signal Bottom: base signal with FM to carry signal |
When the receiver (like the radio in my truck) receives the signal it measures the changes in the wave and converts that data into a usable medium (like music in your car speakers).
What TM does is change the same of the wave by adding indentions to the wave. By doing this extra information can be stored in the waves. In the Daily Star, the chief scientist for the Medusa Scientific, the parent company of TM Technologies, Rick Gerdes said, “At the least, the technology allows at least double the throughput, but in some cases four or five times more, and in some extreme cases 30 times more data.” This method would be a fourth way to transmit data on a wave.
I am interested to see how this would work, since detecting minor changes to the sinusoidal signal would have to be detected by the receiver by separating it from the noise and the loss of information when the wave is quantized or converted from analog to digital. On top of separating the signal from the noise, the receiver needs to sample the data at a high enough rate to detect the indentations in the signal wave. In September, they plan on doing a transmission of a UHD signal, which is a fairly low frequency UHF signal which is between 400 – 800 MHz (for comparison WiFi transmits at 5GHz).
TVTechnology lists two patents pending for Mr. Gerdes,(Patent #5200715 –Waveform modulation and demodulation methods and apparatus and Patent #5327237– Transmitting data with video) that they believe the technology associated from the technology is derived from. If this totally is a killer app, I would expect most of the technology would be kept as a trade secret.
Sunday, July 21, 2013
Predicting Future Locations Paper by Salilek and Krumm
“Far Out: Predicting Long-Term Human Mobility” by Adam Sadilek and John Krumm is an interesting
paper that says you can predict long-term were some will be. There is a good non-technical summary by Camille Sweeney and Josh Gosfield of Fast Company.
The idea is that people move in patterns, and you can predict
where someone will be in the future based on where they are now. The authors
recorded the movements of 703 subjects (307 people and 396 vehicles) from 7 to
1247 contiguous days with the average number being 45.9 days and a standard
deviation of 117.8 days (I’m guessing the 1247 was one of the authors.) They had
33,268 days of location data.
They used Fourier analysis to find the periodicities in
movements of the subjects and used singular value decomposition (SVD), a type of principle
component analysis (PCA), to reduce the dimensionality of the data and to form
predictive weights.
They broke the surface of the globe into triangular cells to
make the locations and movements more finite, and broke up the day into finite
blocks as well. The authors formed the data by breaking up the probabilities
that a subject would be at 11 particular locations by 24 hour blocks and by
days with a separate block for holidays.
Using the past data the authors, formed the predictive
models to predict the locations of people up to 80 weeks in the future. The
results were above 80% accurate and better than their baseline.
Normally, I do not like using PCA for dimensionality
reduction because the top PCA (aka eigen) features may not be the features you need for your modeling goals. For the radar automatic target recognition work, my team and I picked
features manually (using stuff like length and width of targets) to identify
them because we knew the size of the vehicles and physical characteristics we were looking for, but with huge data sets where you may not know what features are best,
PCA could be a better way to go. I have also used discrete cosine transform (DST) for
really large 3D volumes because my PC did not have enough RAM to handle the
matrix transforms of PCA.
I was skeptical of this paper when I first looked at it
because I did not think people’s movement were that regular to be good for prediction, but with their
accuracy people are more predictable then I thought. When you consider the accuracy values you also have to consider most people sleep 6 to 9 hours a night or 42 to 63 hours a week and work 8 hours a day or 40 hours a week and those schedules are fairly regular. So, the authors really need to account for the approximately 72 hours in a week.
A system like this has both applications for marketing and demographics as well as security and defense applications.
Basic Statistics terminology
•
Random Experiment: experiment where outcome cannot be predicted
with certainty.
As an example, you are getting dressed in the morning, you are in a rush and instead of picking socks from your drawer you randomly grab a pair of socks without looking. In this case, your picking of the socks is a random experiment.
As an example, you are getting dressed in the morning, you are in a rush and instead of picking socks from your drawer you randomly grab a pair of socks without looking. In this case, your picking of the socks is a random experiment.
•
Sample space: collection of all outcomes of the
experiment (SS)
Your sample space (SS) is your drawer, it doesn’t contain all the socks in the world but has the collection of all the outcome of the experiment.
Your sample space (SS) is your drawer, it doesn’t contain all the socks in the world but has the collection of all the outcome of the experiment.
•
An Event: an outcome from one experiment (E)
An event would be the socks you ended up picking.
An event would be the socks you ended up picking.
•
A Sample:
a collection of events from repeated trials/experiments (S).
If you randomly pick socks for a week those seven pairs of socks would be a sample.
If you randomly pick socks for a week those seven pairs of socks would be a sample.
•
Random variable:
function X(E) assigning one real value to each element from a sample
space ( features? )
A random variable for the socks
could be a description of the socks like its style (athletic or business type
socks) or the color.
•
Probability:
p = P(E), a number assigned to event representing the fraction of
experiments resulting with the event/outcome A ==> p(x) = P(x = X), the fraction of time
a random variable x = X
In the sock example, you are planning on wearing black pants so you want black socks, so you would want to know the probability of getting a pair of black socks. Let’s say you have 20 pairs of socks and 11 of them are black so p(x=black) would be .55.
In the sock example, you are planning on wearing black pants so you want black socks, so you would want to know the probability of getting a pair of black socks. Let’s say you have 20 pairs of socks and 11 of them are black so p(x=black) would be .55.
•
Probability Density Function: f(x) = p(x=X) on
SS.

My sock example falls apart when I start describing pdfs but these are normally represented as graphs showing the probability of something happening based on different outcomes. Think of a grades in class, so 100 students take a test 10 get As on the test, 20 get Bs, 45 get Cs, 15 get Ds and 10 get Fs. The pdf would have p(x=A) = 0.1, p(x=B) = 0.2, p(x=C) = 0.45, p(x=D) = 0.15, and p(x=F) = 0.1.
My sock example falls apart when I start describing pdfs but these are normally represented as graphs showing the probability of something happening based on different outcomes. Think of a grades in class, so 100 students take a test 10 get As on the test, 20 get Bs, 45 get Cs, 15 get Ds and 10 get Fs. The pdf would have p(x=A) = 0.1, p(x=B) = 0.2, p(x=C) = 0.45, p(x=D) = 0.15, and p(x=F) = 0.1.

•
Probability Distribution Function: F(x) =
p(x<=X) on SS.

A probability distribution function
also called a cumulative density function (cdf) shows the probability of something
happening cumulatively as the values increase so for the grades example if F is
the lowest grade and A the highest, p(x <= F) = .1 (notice stays the same),
p(x <= D) = .25 (or p(x=D) + p(x=F)), p(x <= C) = 0.7 (or p(x=C) + p(x=D)
+ p(x=F)), p(x <= B) =0.9 (or p(x=B)+p(x=C) + p(x=D) + p(x=F)), and p(x
<= A) = 1.0 (or cumulative value of all the outcomes)

•
In summary, shown in the bottom figure, a sample
space (SS) is all possible outcomes, a sample (S) is made up of
experiments (E), the sample is used to model the SS with
variables (X) to form a pdf (f(x))
Subscribe to:
Posts (Atom)